Results: Intel Core Ultra 7 265K + GeForce RTX 2080 Ti
Intel Core Ultra 7 265K and GeForce RTX 2080 Ti paired: expected FPS in 10 games at 1080p, 1440p and 4K, bottleneck analysis and the recommended power supply wattage.
Prices in shops
Prices checked:
Prices at UK shops today
Stock and prices come from UK shops we track (Back to the Office, GamingKit, PCHUB.UK). Prices are in pounds and include VAT.
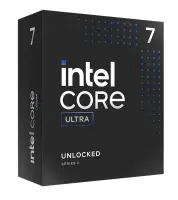
- Intel Core Ultra 7 265K: from £327.52 at GamingKit. Lowest in the last 30 days: £289.47.
What it costs to run in the UK
At full load the pair draws about 375 W. At 26.32p per kWh (Ofgem energy price cap, October to December 2026) that is £0.10 an hour of play, or about £72 a year at 2 hours a day.
Expected FPS
Average FPS on “High” settings
| 1080p FPS | 1440p FPS | 4K FPS | |
|---|---|---|---|
| Fortnite | 185 FPS | 135 FPS | 85 FPS |
| Counter-Strike 2 | 310 FPS | 225 FPS | 140 FPS |
| Cyberpunk 2077 | 100 FPS | 75 FPS | 45 FPS |
| Valorant | 425 FPS | 310 FPS | 190 FPS |
| COD: Warzone | 165 FPS | 120 FPS | 75 FPS |
| Battlefield 6 | 120 FPS | 90 FPS | 55 FPS |
| PUBG: Battlegrounds | 180 FPS | 130 FPS | 80 FPS |
| Rainbow Six Siege | 250 FPS | 180 FPS | 110 FPS |
| Marvel Rivals | 80 FPS | 55 FPS | 35 FPS |
| GTA V | 80 FPS | 55 FPS | 35 FPS |
| Red Dead Redemption 2 | 115 FPS | 85 FPS | 50 FPS |
| Escape from Tarkov | 95 FPS | 70 FPS | 40 FPS |
| Rust | 95 FPS | 70 FPS | 40 FPS |
| Minecraft | 435 FPS | 435 FPS | 300 FPS |
Bottleneck by resolution
Which component limits performance at each resolution
Power supply
Estimated load: 551 W · Recommended: 700 W
Put together a compatible build or compare component prices across retailers.
Other graphics cards with Intel Core Ultra 7 265K
Other processors with GeForce RTX 2080 Ti
Other comparisons
The figures are estimates - real FPS depends on the game, settings and drivers. The FPS model is calibrated against public TechPowerUp, Tom’s Hardware and Hardware Unboxed benchmarks. CPU and GPU calibration: July 2026 · Newest games added: September 2026. How we calculate FPS